This is the second in a two-part series on telling your compelling story with data. To get organized and get comfortable working with data, see Tell Your Compelling Story with Data: Part 1. When you've done that, you're ready to...
Make your data speak
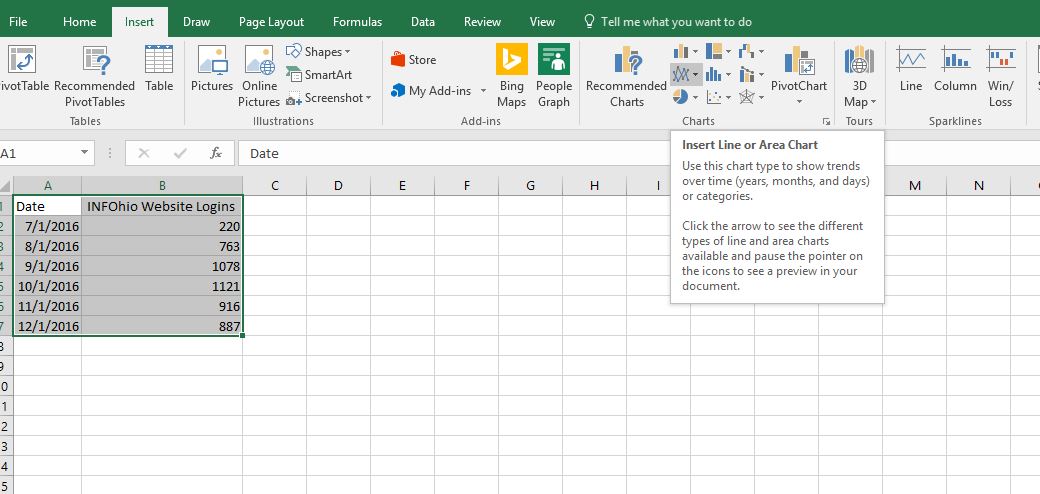
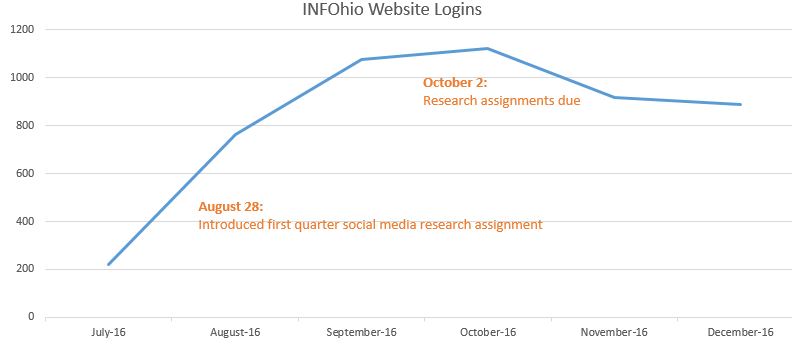
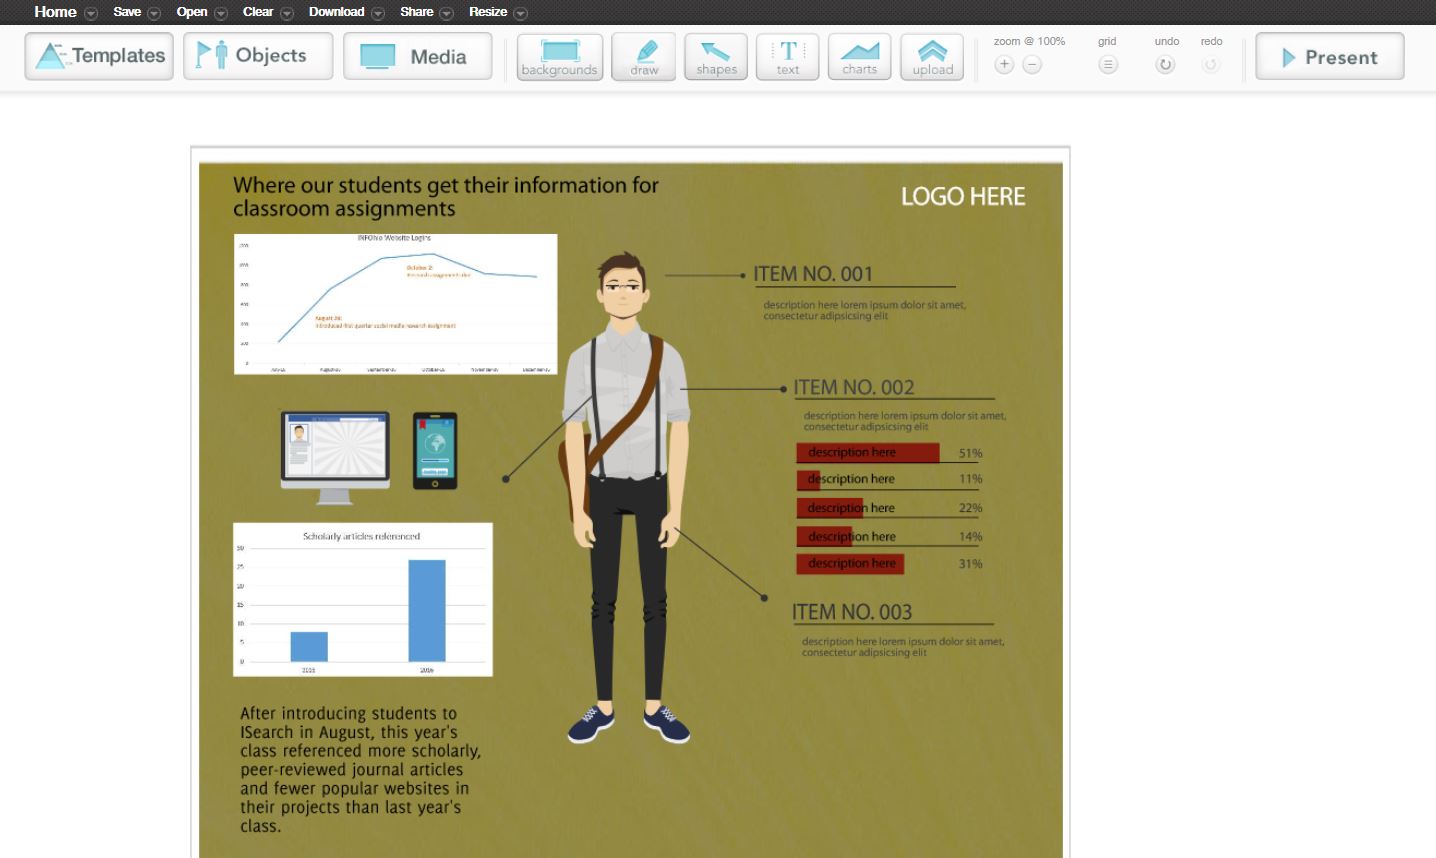
Numbers in a vacuum are rarely impressive. Now that you’ve got some organized data, there are lots of free applications that let you get really jazzy with your numbers. What should you do? Use your data to tell your story. You can do this by creating some basic charts, graphs, or graphics. Revisit your INFOhio Use Data spreadsheet and select your data. Insert a line graph that demonstrates login trends over the course of the school year.
What other data points can you find and use to make your story more compelling? Consider using student work. Look at the all the bibliographies for a project you repeat annually. How many academic resources did students use this year after you introduced them to ISearch? Look back at student work from the previous year. How many academic resources did students use before you introduced them to ISearch?
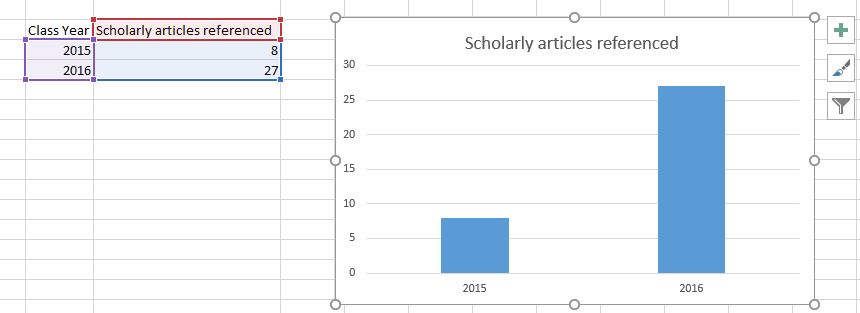
Your graphs may not be exciting just yet, but your administrator is likely to be more interested in this representation of your data than she would in a single bullet point stating that your district had 887 website logins for the month or that students used 27 high-quality academic articles. Consider ditching the bullet points altogether and using a tool like Canva, Easel.ly, Infogr.am, or Tableau Public to create an infographic.
Free Tools for Data Visualization
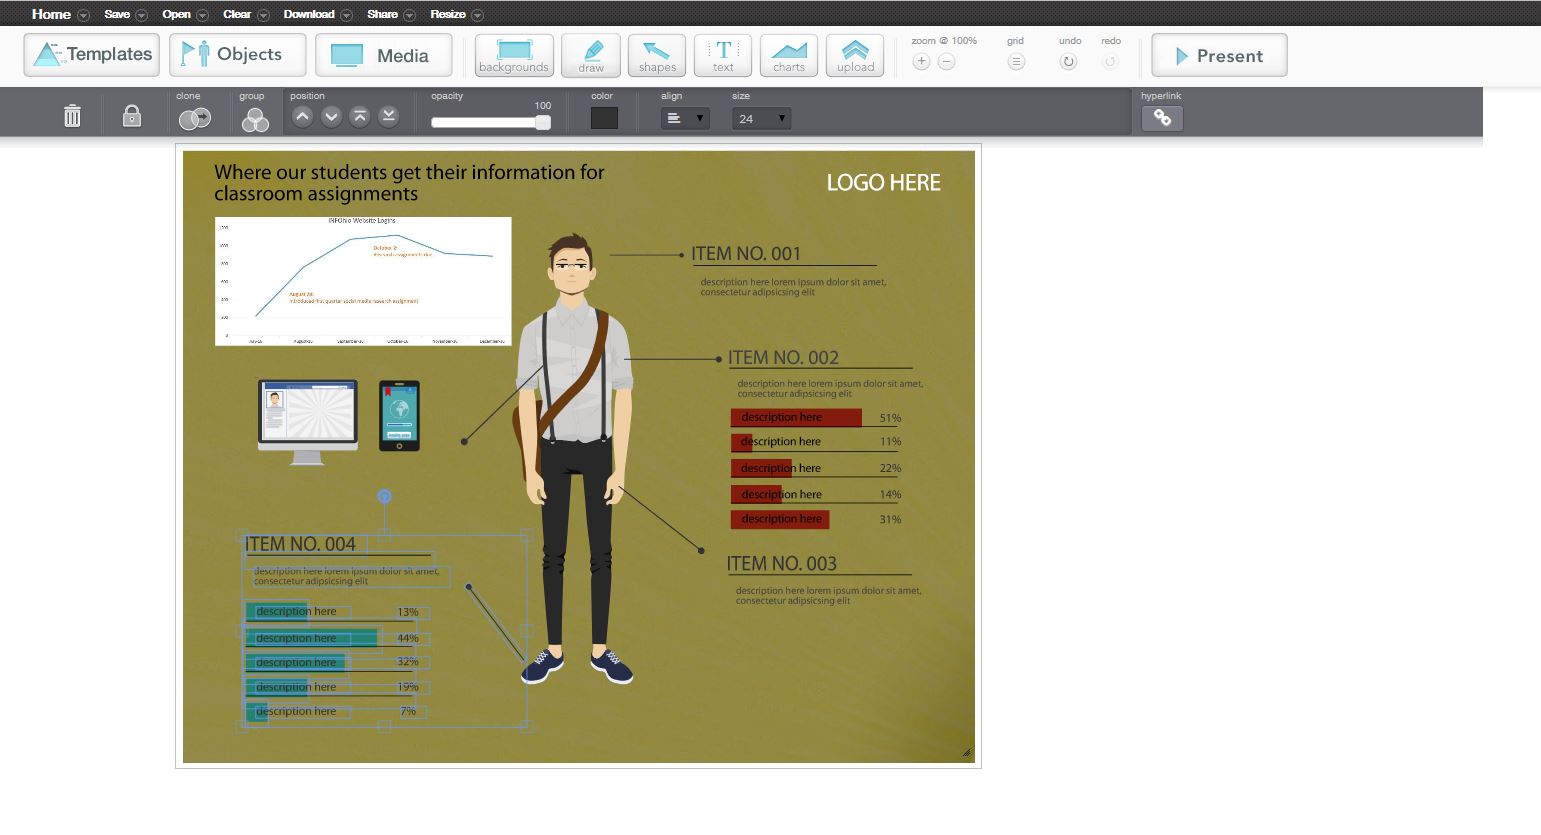
If you’ve heard about infographics and you’ve been scared off, now is the time to revisit applications like Canva or Easel.ly. These applications have fun icons or pleasant color schemes already established for users, which make them excellent tools for creating lovely electronic posters or bulletin boards.
Save your charts and graphs as images and upload them to Easel.ly to create customized eye-catching posters that use your data to tell your story.
Use your words
A chart and nice icons within an electronic poster can help catch an administrator’s eye, but sometimes you have to use your words.
Consider adding concise text to your graphs that can help explain trends. In Easel.ly, it's easy to cut anything on the page and replace it with images or text.
A picture is worth how many words?
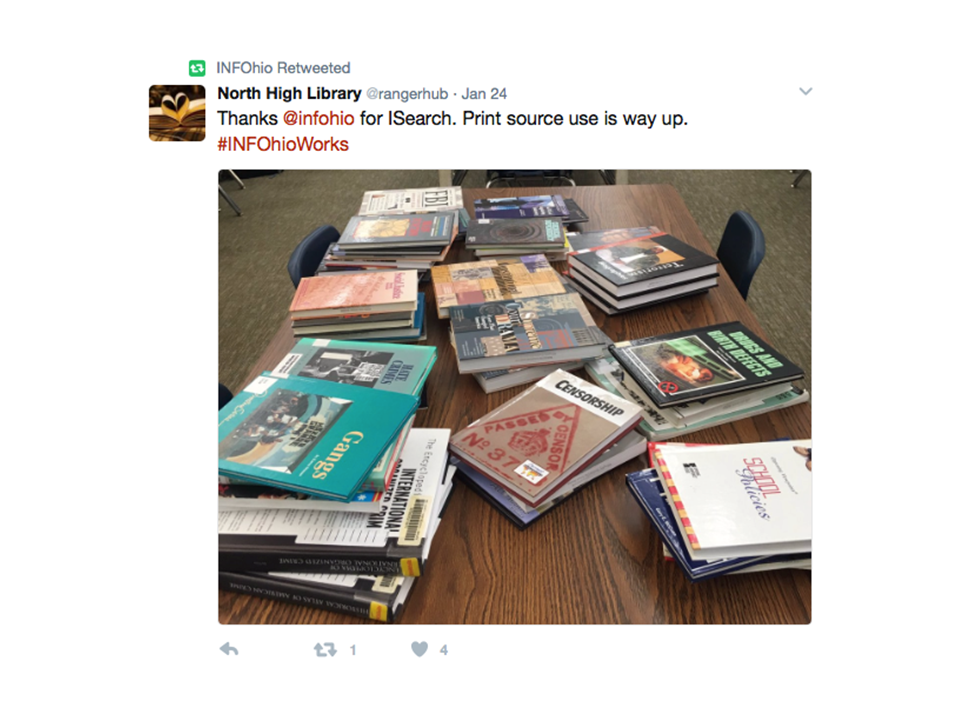
Document your teaching and your programs with photos and videos…and keep them organized! There's nothing worse than knowing you have the perfect picture to help tell your story, but not being able to find it because it's on your phone...or was it on your camera? Or did a colleague take that picture with her phone? Save your work pictures in one spot, whether that's on your work computer or on a special flash drive that you use only for work photos. Make a spreadsheet of your pictures that includes the file name and a short description or a few tags. Photos are valuable data points that can punctuate your story.
Keep learning!
When it comes to using data to tell a story, there are always new skills and shortcuts to learn. OhioNet regularly hosts webinars on topics related to data and statistics and all PreK-12 schools in Ohio are Premium members of OhioNet, courtesy of INFOhio.
Review this webinar:
Explore these recommended readings:
Also see Kathy Schrock's Infographics as a Creative Assessment. Although the site focuses on using infographics as educational tools, librarians can learn about different tools for creating effective infographics.
Finally, library staff working in all types of libraries in Ohio have free access to over 500 online, self-paced courses through the State Library of Ohio. Many of these can help you collect and organize your data, create data visualizations, or make decisions based on your data.
Have you created a report or an infographic that you'd be willing to share? Save it to a cloud drive and give it a shareable link. Join Open Space, join the Future Ready Librarians group, and share the link in the School Library Annual Report discussion.
Erica Clay is the Director of INFOhio. Prior to this, she was a member of INFOhio's Instructional Team. Before joining the INFOhio team, Erica was a Library Director and a Humanities Librarian in academic libraries, a Knowledge Management Editor at a university, and taught K-8 music and PreK. She earned a BA in English and Music and a Master of Humanities from Wright State University, and a Master of Library Science from Indiana University.


